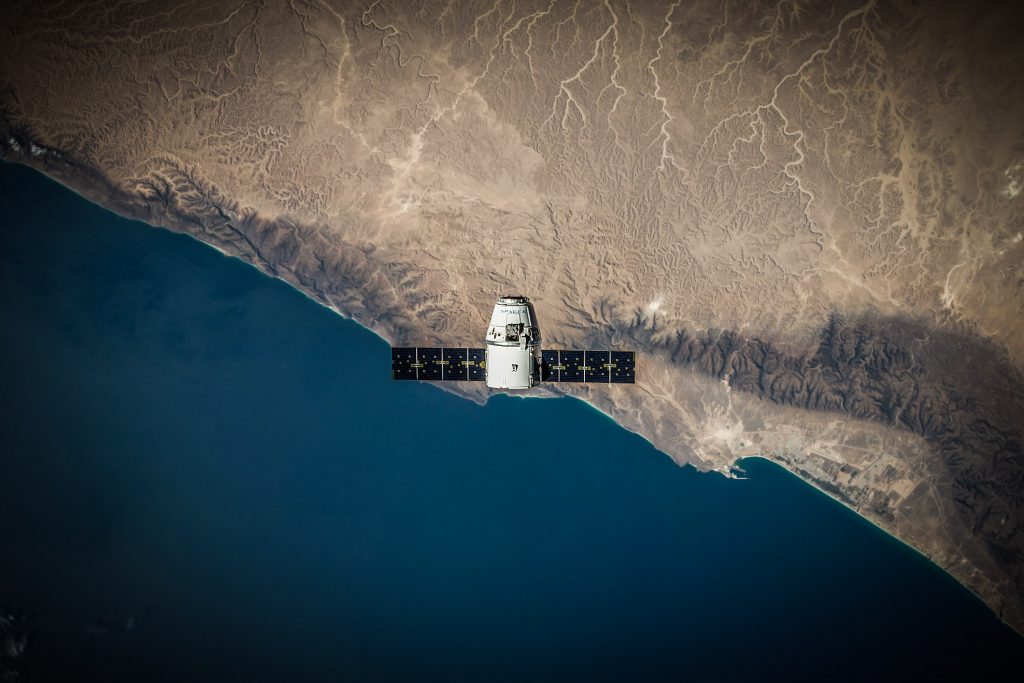
Once you are aware of farmer-led irrigation development and the fact that it is unreported, you can start to get more insight into where it takes place, what it looks like, and what its impacts are. To do this, you can for instance use satellite visible spectrum or radar images, specific questionnaire apps such as Open Data Kit (ODK), and government reports.
Using satellite imagery and remote sensing to identify farmer-led irrigation development
Satellite imagery analysis by the International Water Management Institute (IWMI) has produced findings suggesting that, across sub-Saharan Africa, irrigation may be two to three times more extensive than previously thought. In some countries, such as Ethiopia, it is even greater.
Satellite imagery isn’t a perfect solution. For example, it may not always distinguish between irrigation and natural vegetation. But even when it is unable to provide an accurate estimate of the extent of irrigated agriculture, it still provides valuable information to help us understand the presence of irrigated agriculture.

Mapping farmer-led irrigation development is more challenging than registering large-scale government projects that have fixed infrastructure. Not only are farmers’ irrigation initiatives expanding more rapidly than can be captured by typical surveys conducted at 5-year intervals, but development of irrigation will also expand and contract in response to variations in water availability (i.e annual rainfall variation). Therefore, the frequency of mapping is much more important for farmer-led irrigation development than the rather static government-initiated irrigation projects.
How one project used radar imaging
- The Studying African Farmer-led Irrigation (SAFI) project has undertaken a pilot study using radar imaging data from ESA Sentinel-1 satellites to estimate areas of paddy rice in a number of regions in Tanzania.
- High-resolution (10 metre) images available since September 2016 provide images at 12-day intervals that are unaffected by cloud cover.
- GPS coordinates for sites of irrigation, observed from the ground, were used to identify data points with which to ‘train’ an algorithm to recognise a time-series ‘signature’ of reflected radar signals for irrigated crops over the course of a growing season.
- The extent of an irrigation ‘signature’ is then mapped at a regional scale.
The pilot study suggests that the areas with a radar reflection pattern characteristic of irrigated (paddy) rice are between three and ten times larger than the areas of irrigation recorded in agricultural census data. The discrepancy is likely due to farmers’ initiatives in controlling water for paddy cultivation being overlooked in surveys.
Using geographic information systems to identify farmer-led irrigation development
If you want to identify large areas of land that may be irrigated, but which have not been identified in official reports, then geographic information system mapping may be able to help.
A geographic information system (GIS) is a framework for gathering, managing, and analysing data. GIS integrates many types of data. It analyses spatial location and organises layers of information into visualisations using maps and 3D scenes. GIS can also help identify what crops are being grown as well as whether irrigation is taking place.
QGIS is an open-source GIS application that you can download and use free of charge. Their website provides many tutorials and training materials so that you can get started on your own.
Collecting data on farmer-led irrigation development when you’re in the field
Government reports, or satellite mapping can give you some information about the occurrence of irrigation in an area. But to help you understand irrigation activities being carried out by farmers themselves, you’ll need to speak to the farmers to get greater information about their crops, the irrigation procedures, how they are managed, the impact irrigation has – and much more.
To collect this data, you can use tools such as the Open Data Kit (ODK) application on your phone or tablet, which can make it easier to collect, process, and analyse data than paper-based surveys.
Using Open Data Kit you can:
- Create a questionnaire form for use on mobile devices;
- Fill out the online form in the field, which is then transmitted to an online database;
- Store, view and retrieve aggregated data for analysis;
- Have accurate information about the site where you did the interview, because of GPS links to real-time mapping and monitoring.
Key messages:
|
Suggested further reading:
- Re-introducing Politics in African Farmer-Led Irrigation Development: Introduction to a Special Issue.
- Getting Started Using QGIS
- Using Open Data Kit (ODK)
- Full reference list
Acknowledgements:
- Ramson Adombilla, Irrigation Engineer, CRIS Savanna Agricultural Research Institute, Ghana
- Chris de Bont, Stockholm University, Sweden
- Phil Woodhouse, Global Development Institute, The University of Manchester
