
Irrigators generate cash by selling crops at expanding, urban food markets. Commercial trading networks and improved communications are vital for these activities. Mobile phones are increasingly prevalent amongst farmers.
Households that irrigate are wealthier than those that do not, as the graphs below show. But are they wealthy because they irrigate, or do they irrigate because they are wealthy?
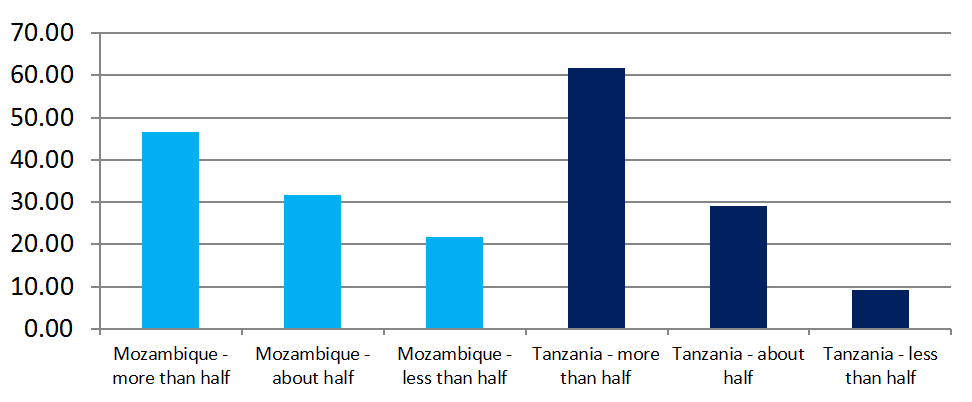
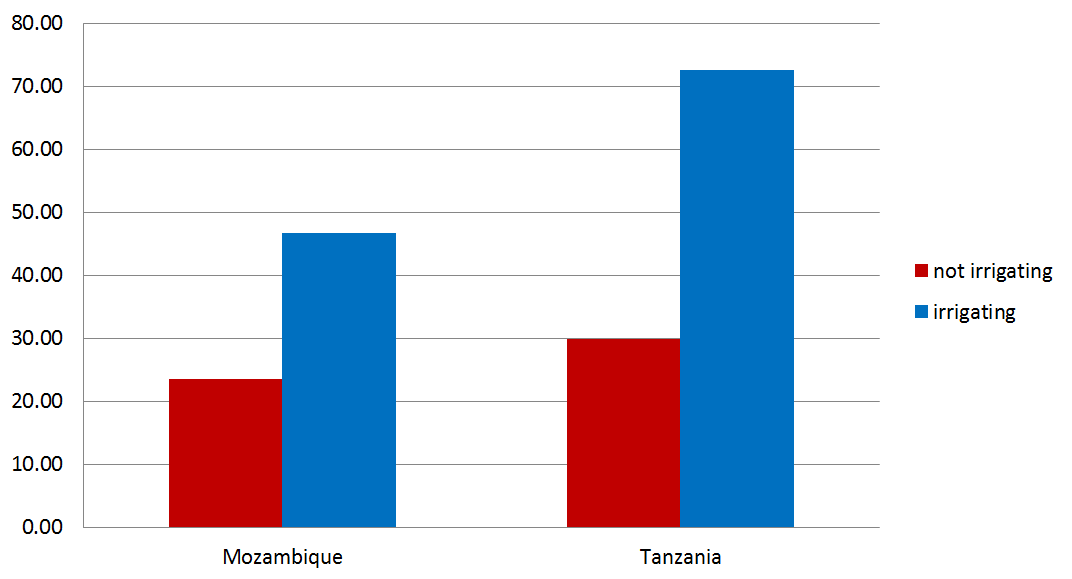
In both Mozambique and Tanzania between 80%-90% of households that irrigate said irrigated crops account for at least 50% of their income. This suggests that irrigating households are dependent on income from irrigation for their higher accumulation of assets.
Contribution (%) of irrigated crops to irrigators’ total income
The following are indicators of household wealth that suggest higher wealth levels among irrigating households than non irrigating households.
Housing quality index
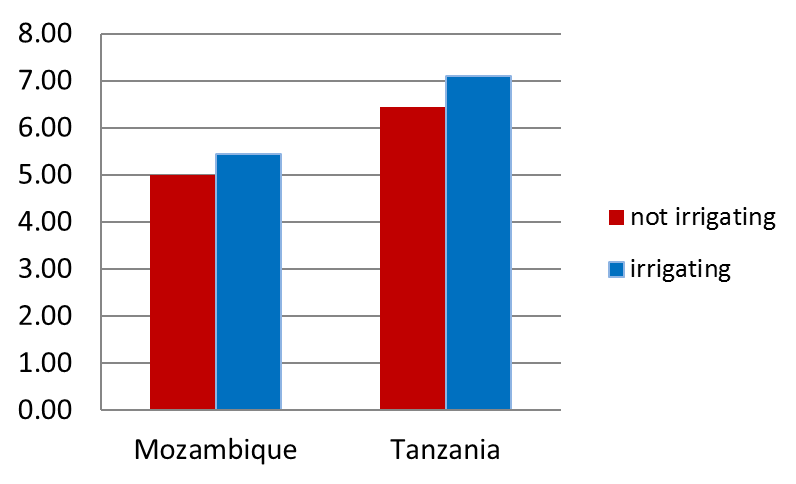
The graph above shows that households that irrigate have housing which ranks higher on the quality index.
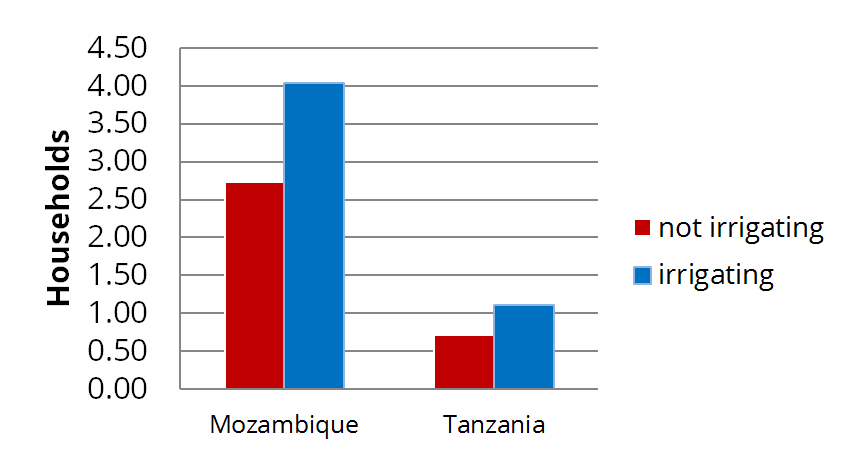
Index of asset ownership
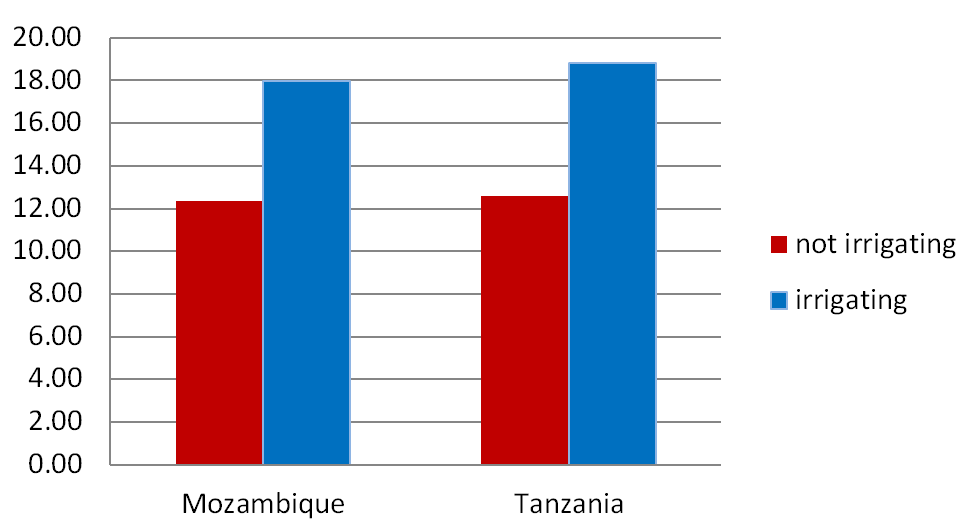
The graph above shows that households that irrigate accumulate more assets than those that do not.
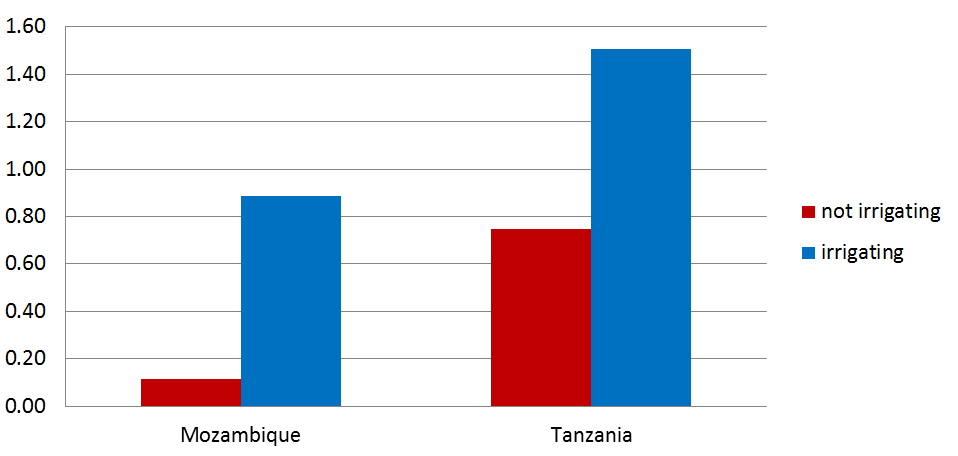
Average number of months of food shortage
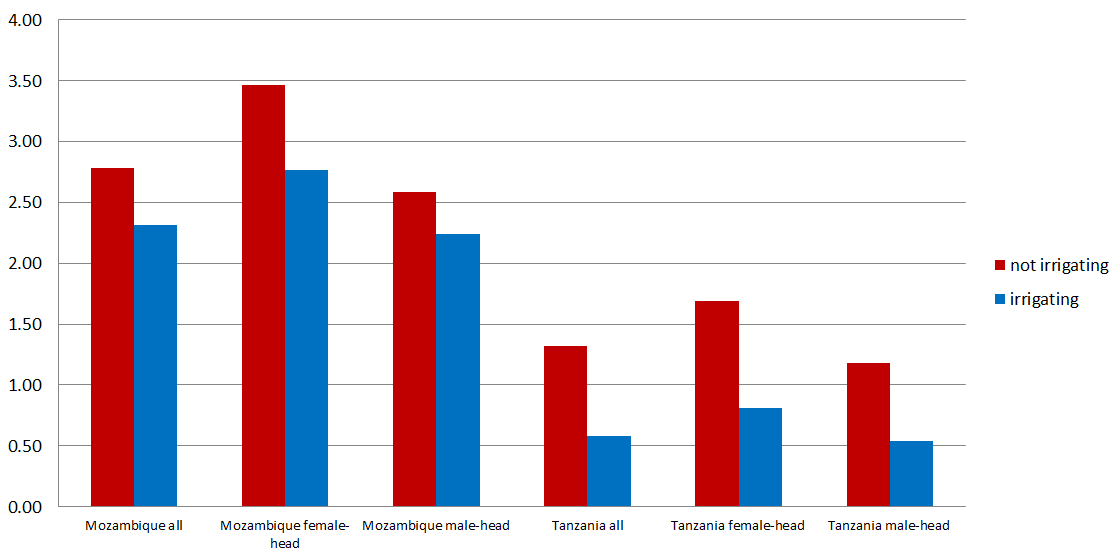
Households that irrigate also have greater food security. Although there are fewer female-headed households among irrigating than non-irrigating households, these female-headed households could benefit more from irrigation.
On average, households who irrigate in Mozambique said they endured food shortages annually during an average of 2.34 months compared to 2.87 months for households without irrigation. In Tanzania, these figures were 0.58 months compared with 1.35 months.
When female-headed and male-headed households are compared, the irrigating female-headed households appear to benefit more relative to their non-irrigating neighbours; reducing their annual period of food shortage by 0.67 months in Mozambique and 0.91 months in Tanzania.
The reduction in duration of food shortage for irrigating compared to non-irrigating households is smaller (0.42 months in Mozambique and 0.68 months in Tanzania) among male-headed households.
Irrigating households tended to have more land and invested more in inputs such as fertiliser and hired more labour.
Average area (ha) farmed per household
The graph above indicates that on average, farmers using irrigation farmed a larger area than those who relied on rainfall alone.
Average area of irrigated land (ha) per household using irrigation
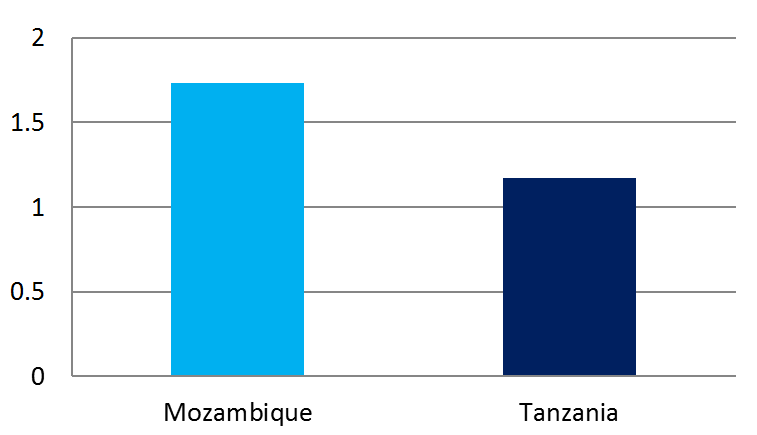
The area of crops irrigated averages 1.8 ha per household in Mozambique and 1.2 ha in Tanzania. Although this area is fairly small, production was strongly market-oriented.
Input use (index of fertilizer, improved seed, pesticide) & % of households employing farm labour
The first graph below shows that irrigators tend to have a higher input use; whilst the second graph shows they employ more farm labour, when compared to non-irrigating households
Farmer’s prior links with the area (%)

Data recorded on households’ prior links to the area in which they are farming shows relatively high percentages of households (25% in Tanzania and over 40% in Mozambique) with no prior family links to the area. Although these incoming settlers included both irrigating and non-irrigating households, the former tend to be less common than among households with previous family links in the area.
In conclusion, the SAFI data shows that irrigators cultivate larger plots, use more inputs and employ more farm labour. They also tend to be wealthier, obtain more than half of their income from farming, and experience fewer months of food shortage.